ユーザ名: anonymous
- 解答
- 履歴
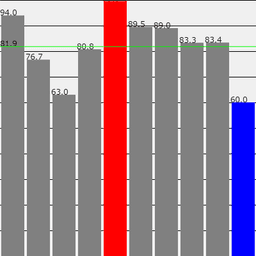
[課題]: ランダムな数値が10個含まれている配列の平均値,最大値,最小値を求めましょう.また,配列の値を棒グラフとして可視化しましょう.
Q. 上端から高さhの四角形を描画するプログラムを確認しましょう
正解出力:

あなたの出力:
loading...
あなたのコード:
1function setup(){
2  createCanvas(400, 400);
3  background(240);
4  let scores = [];
5
6  for(let i = 0; i < 10; i++){
7    scores[i] = random(20, 100); // 60以上100未満のランダムな数を代入
8  }
9  console.log(scores);
10
11  let sum = 0;
12  for(let i = 0; i < scores.length; i++){
13    sum += scores[i];
14  }
15  console.log(sum);
16
17  //平均値
18  let average = sum / scores.length;
19  console.log(average);
20
21  //最大値
22  let largest = 0;
23  for(let i = 0; i < scores.length; i++){
24    if (largest < scores[i]) {
25      largest = scores[i];
26    }
27  }
28  console.log(largest);
29
30  //最小値
31  let smallest = 100;
32  for(let i = 0; i < scores.length; i++){
33    if (scores[i] < smallest) {
34      smallest = scores[i];
35    }
36  }
37  console.log(smallest);
38
39  //棒グラフ
40  const n = 10;
41  fill(0)
42  for(let i = 0; i < n; i++){ line(0, height * i / n, width, height * i / n); }
43  for(let i = 0; i < scores.length; i++){
44  const dx = width / scores.length;
45  const h = height * scores[i] / 100;
46  }
47}
48